Enriching content recommendations on Flanders' national streaming platform
Exploring how cross-platform data can enhance content recommendations through expert reviews and focus group evaluations.
Exploring how cross-platform data can enhance content recommendations through expert reviews and focus group evaluations.
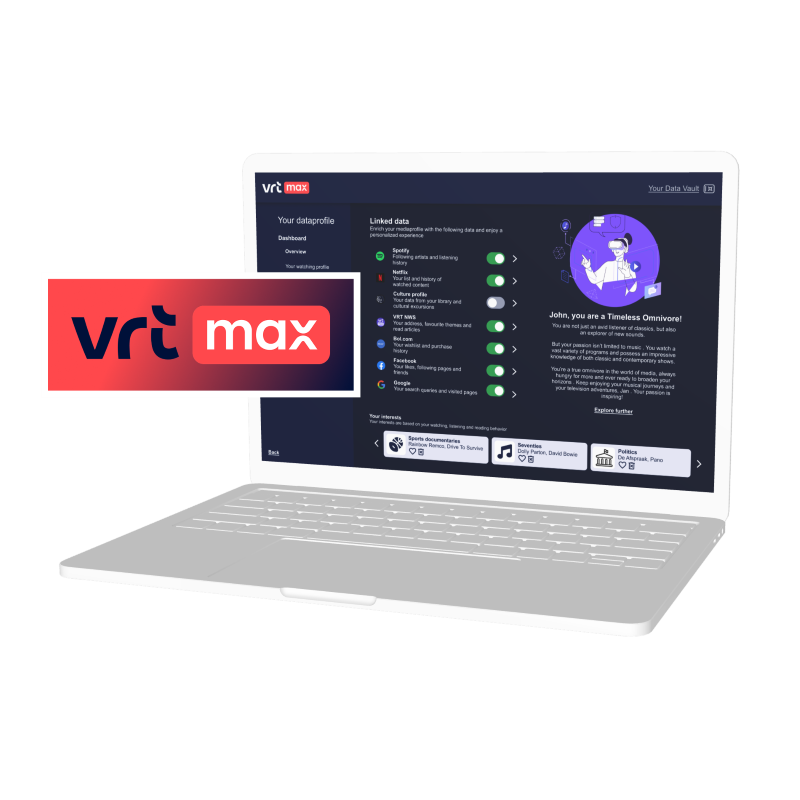
At the request of the Flemish public broadcaster VRT, we explored how data from external platforms such as Spotify could be used to enrich personalized recommendations within a streaming service, without compromising user privacy. By integrating a personal data vault into the VRT MAX platform, we investigated how cross-platform data sharing could make personalization more meaningful, transparent, and user-controlled.
Using a research-through-design approach, we developed an interactive prototype in Figma, demonstrating how users could connect their personal data vault to import various data from other services. The goal was to understand how users perceive such an integration and what features foster trust, transparency, control, and willingness to share data.
We created a medium-fidelity prototype in Figma, simulating the experience of logging in to the VRT MAX streaming service using a data vault. Once connected, users could grant access to specific data types to personalize recommendations across platforms.
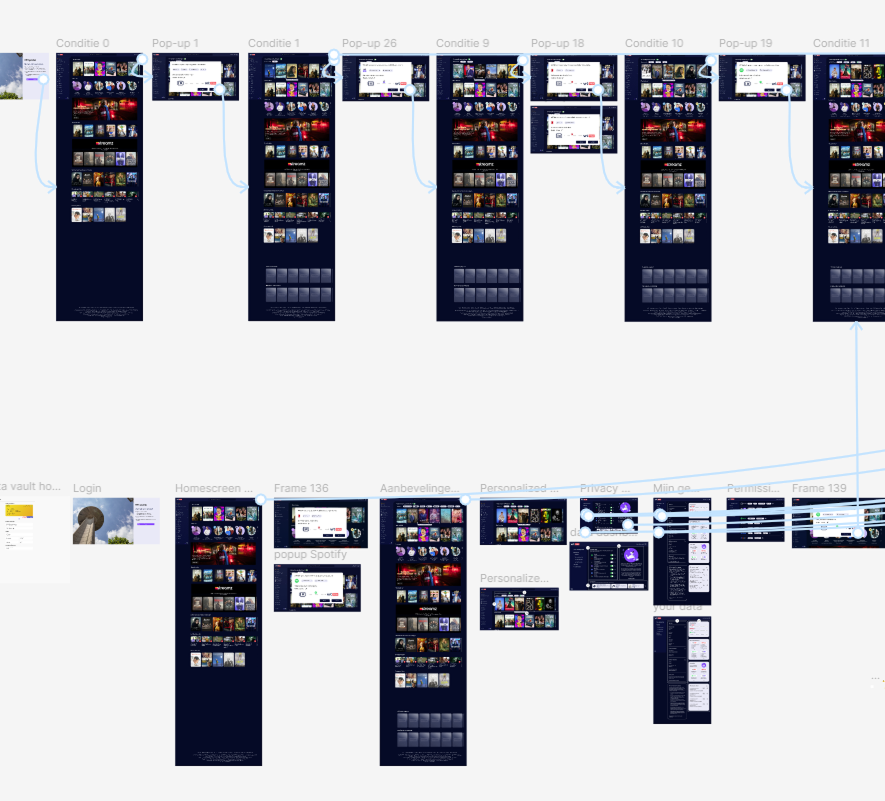
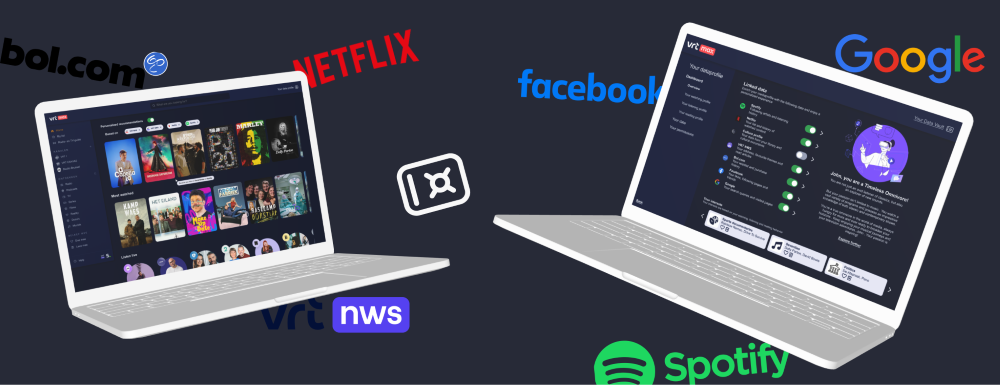
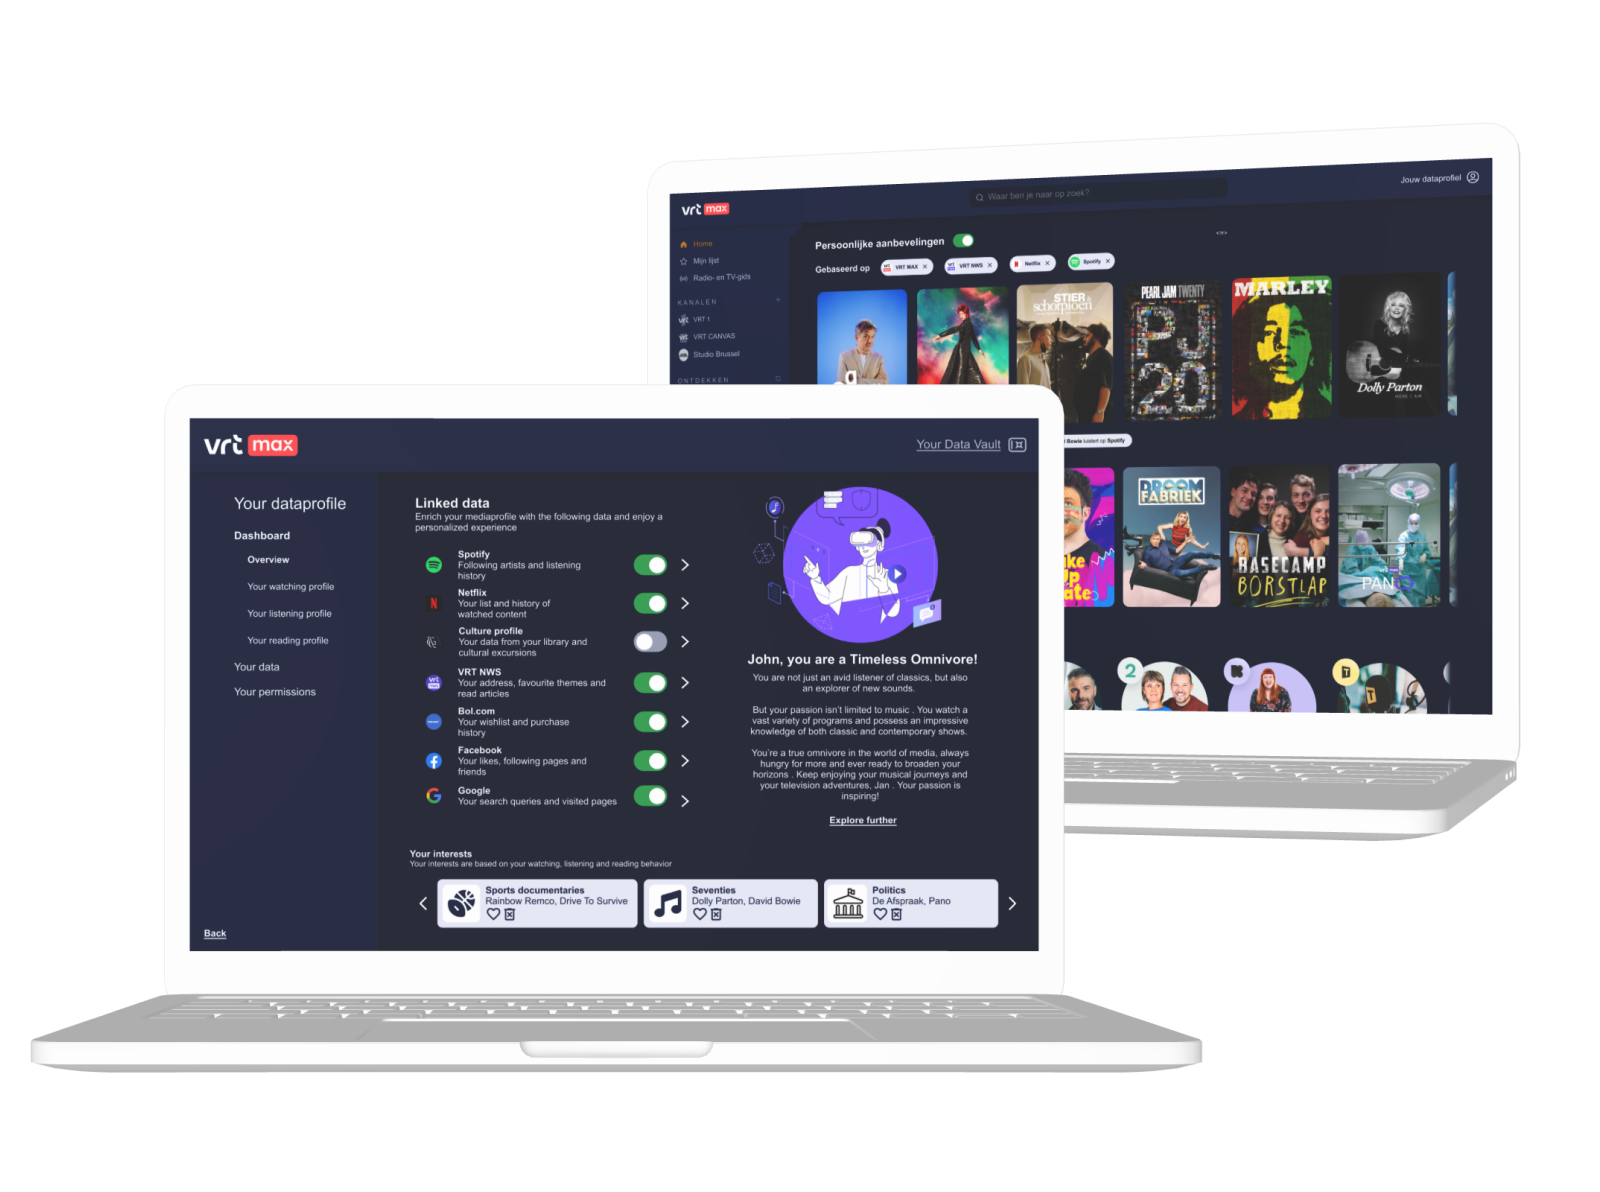
To examine how users respond to sharing various kinds of personal data for personalized recommendations, the prototype included a series of data request pop-ups, each asking permission to access a specific dataset stored in the user’s personal data vault. After each consent decision, the home screen dynamically updated, showing new rows of recommendations generated from the newly shared data.
For instance, granting access to Spotify listening history revealed music documentaries featuring frequently played artists, while sharing Netflix viewing data refined content suggestions based on preferred genres. The requests deliberately varied in sensitivity and relevance (ranging from closely related streaming data to more distant sources such as Facebook likes) and were branded with familiar platform names to create a realistic and relatable user experience.
Several transparency and control enhancing features were included to illustrate the potential of personal data vault implementation, including:
These features aimed to make data exchange understandable and reversible, helping users feel more in control of their information.
Before starting the user evaluation, five experts in UX, innovation, privacy, and Human-Data Interaction provided feedback on the transparency- and control features, and visual clarity. Their input guided the second iteration of the data-flow visualization and improved interface accessibility.
Two focus groups with a total of 19 participants explored how potential users perceived the integration of a personal data vault into the streaming platform. After a brief introduction to the concept, participants were guided through the interactive prototype, followed by discussions on their attitudes toward data vaults and their comfort levels with sharing different data types.
“I am so often in a filter bubble already and I am getting profiled so much that I want to break out of it. I want to get suggestions that I wouldn’t look for myself.”
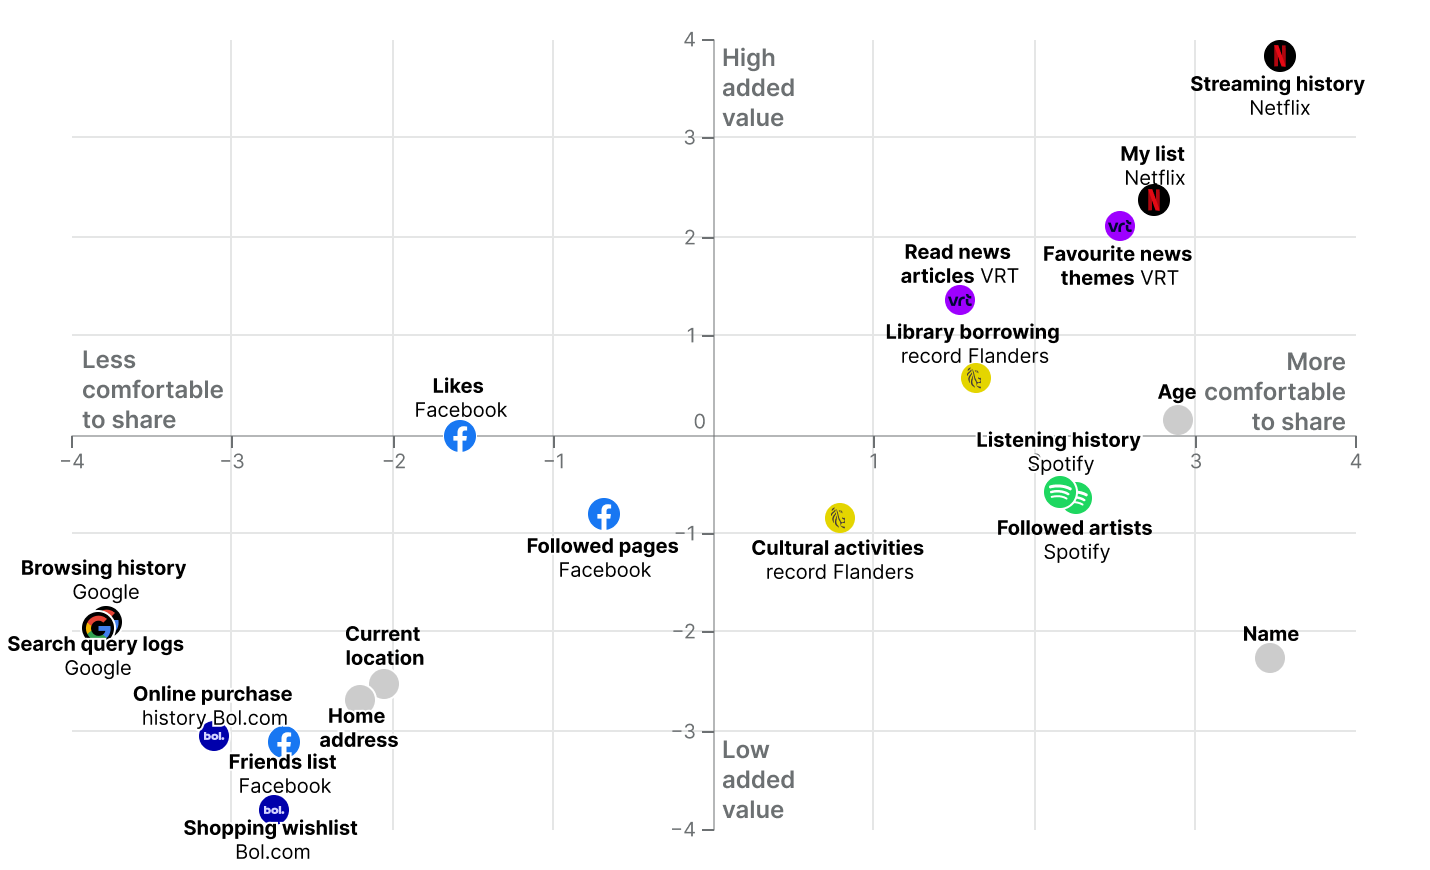
After completing the walkthrough, participants rated 19 different data types based on two factors: their comfort level with sharing the data and the perceived added value it could bring to personalized recommendations. The results revealed a positive relationship between these two dimensions — the higher the perceived benefit, the more comfortable participants felt sharing their data.
As shown in the graph below, participants were most comfortable sharing media-related data, such as Netflix viewing history and read news articles, which they saw as directly relevant to improving recommendations. In contrast, online behavioral data—like browsing or purchase history—was considered both more sensitive and less valuable. An exception was name data, which, while not seen as sensitive, was viewed as offering little added value for personalization.
Our findings supported VRT in identifying which features to prioritize in their ongoing exploration of personal data vaults, guiding the follow-up research project Solid4Media. The insights into users’ willingness to share different types of data provided practical direction for future design efforts, emphasizing the need to clearly communicate the value of data sharing and ensure transparency and user control remain central. Beyond this project, the results contributed to a broader understanding of how cross-platform personalization can be achieved responsibly through user-centered data management.